Dimensions can be the drivers for more efficient reporting. Dimensions enable you to construct and use reports with greater speed and efficiency, enhancing design and performance. There is no practical limitation with the ability to create up to 500 dimensions in Solver. This article will define dimensions, provide examples, and demonstrate how to use them to build reports.
What Are Dimensions?
Dimensions are tables that store records used to summarize and categorize data that you want to measure in your transaction tables, also known as fact tables. If you’ve ever used an accounting, payroll, sales, or similar system, you have used dimension tables, even if you didn’t realize it. You may have seen them called master tables or setup tables. For example, accounts are dimensions. Warehouses, employees, departments, and customers are dimensions, too.
Dimensions are different from transactions. When you enter a transaction for an invoice, think of the entire invoice as the transaction, aka fact table, record. If you visualize each transaction as a row in a spreadsheet, several columns will contain dimensions.
Here’s an example of data from a sample General Ledger transaction table:
 Figure 1 – Example of dimensions used by a fact table.
The highlighted columns are dimensions. Those items are joined to dimension tables that contain information about the items. For example, the Account dimension table stores the account description and account type.
What Are the Benefits of Dimensions?
You may have several dimensions if you’re using an accounting, billing, payroll, or other type of system. For example, Microsoft Dynamics 365 Business Central has global and shortcut dimensions but enables you to create more dimensions. Sage Intacct, Microsoft Dynamics 365 Finance, Salesforce, and others have dimensions. They use these dimensions to facilitate data entry and reporting.
Here are some of the technical benefits of dimensions:
Setting Up Dimensions
Solver enables you to set up hundreds of dimensions. These dimensions can be shared among modules. (A module is a fact table and related dimensions.) Dimensions can have many columns but the number should remain as low as possible for storage reasons.
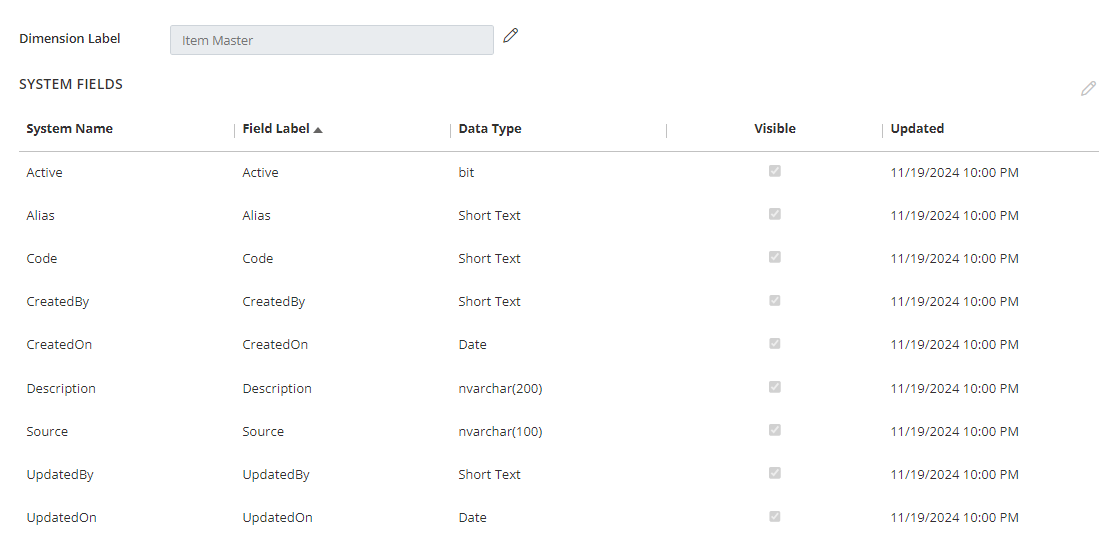
Here is how a dimension appears:
 Figure 2 – Dimension configuration in Solver.
To create a dimension, a user can follow these steps:
- Go to the Data Warehouse section.
- Select Configuration >> Dimensions.
- Select the + sign.
- Enter a unique dimension name.
- Rename pre-defined columns and add new columns.
When a new dimension is created, the system will automatically add eight columns, as shown at the top of Figure 2. These columns can be renamed by selecting the column and the edit icon.
 Figure 3 – How to change a column name for a dimension.
When creating reports, report authors will see the field label instead of the system name. However, they will be able to see the system name, too. In addition, the visibility of columns can be determined by marking and unmarking the Visible checkbox.
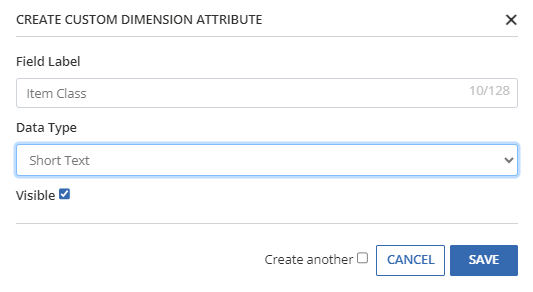
To create a custom column, select the + sign and enter a unique column name, and select a data type.
 Figure 4 – How to add a custom column.
There are six data types:
- Short Text – Up to 50 characters
- Long Text – Up to 512 characters
- Comment – Up to 8K characters
- Amount – Numeric with a 29,12 precision
- Integer – Numeric with no decimal places
- Date – Date/time
The custom columns will have a system name of UDF999, which allows you to have up to 999 columns. You will be prompted to enter a field label. You can, and should, use spaces to make the label easy to read.
Here is a completed custom column.
 Figure 5 – Example of a custom column.
You can change the field label at any time. You cannot change the data type. You can remove the column and add a new one with the correct data type. However, if you delete the column, the data goes with it.
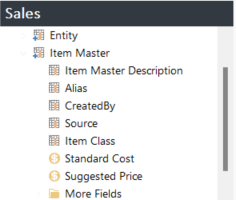
One note about “Amount” columns: Solver automatically treats these as fields for use in totals. You can sum integers, too, but amount fields appear with a $ icon indicating they are used for them.
 Figure 6 – Amount fields examples.
Solver comes preconfigured with several dimensions.
- Account
- Category
- Currency
- Customer
- Entity
- Item
- Period
- Scenario
- Vendor
If you are using the QuickStart option, available for certain systems, you also will see a dimension called Stargate.
Dimension names start with “d_” and follow those characters with the preconfigured dimension names or a system name for custom dimensions. For example, the table name for Account is d_Account. The table name for a custom dimension is d_Dim999 where 999 is replaced by a number.
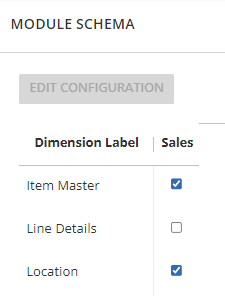
Once you create your dimensions, you need to associate them with one or more modules. This action is done using the Module Schema window. When you select the dimensions to be used, Solver creates a column in the module for each dimension.
 Figure 7 – Module Schema window screenshot.
From a table perspective, the column created will have the name of the dimension without the preceding “d_” characters. For example, in the case of a fact table named Sales, the column names for the Account (preconfigured) and Item Master (custom) dimensions would be Account and Dim190, respectively.
Extending Your Source System
An advantage Solver has over a reporting application that only uses the source system’s data is that you can extend the data by adding columns and more dimensions. For example, the source system may have departments but no regions. You can add a column to the department dimension for region and use it for reporting. You also can add a new dimension.
For example, if you’re using Business Central, a department dimension uses the Code and Description columns. You can go to the department dimension in Solver and add a custom column named Division. You can then use a Rule to update or manually maintain the division column.
Another example is a combo dimension. This type of dimension can be useful for cascading filters. For example, you may have two dimensions: Region and Customer. Customers can only belong to one region. When you create your filters, you want the user to select a region value and only see customers within that region. A combo dimension provides that functionality.
Summary
Dimensions play a key role in reporting. They enable report creators to easily find columns because the data is organized. They also help reduce the size of the fact table, thereby providing an increase in reporting performance. With the ability to create hundreds of dimensions, Solver provides an environment where data models can be enhanced for reporting.
To learn more about how Solver can help you leverage consolidated data to accelerate informed decisions, connect with us today. Business Technology Services at Forvis Mazars is an award-winning partner of Solver Global. Our experienced technology consultants can help you advance your reporting and planning processes.
