
Many organizations have meetings where numbers are presented using Microsoft PowerPoint. For some of those organizations, Microsoft Power BI is the source of those numbers. However, in many cases, users export data or take screenshots and manually update their presentations. Beyond that, if a question is asked for which there is not a screenshot, the presenter must go back to Power BI and export more data. This article is going to walk through how to integrate Power BI and PowerPoint.
Create the Report
The first thing you need to do is create a Power BI report and publish it to the Power BI service. The report can be created using Power BI Desktop or within the service.
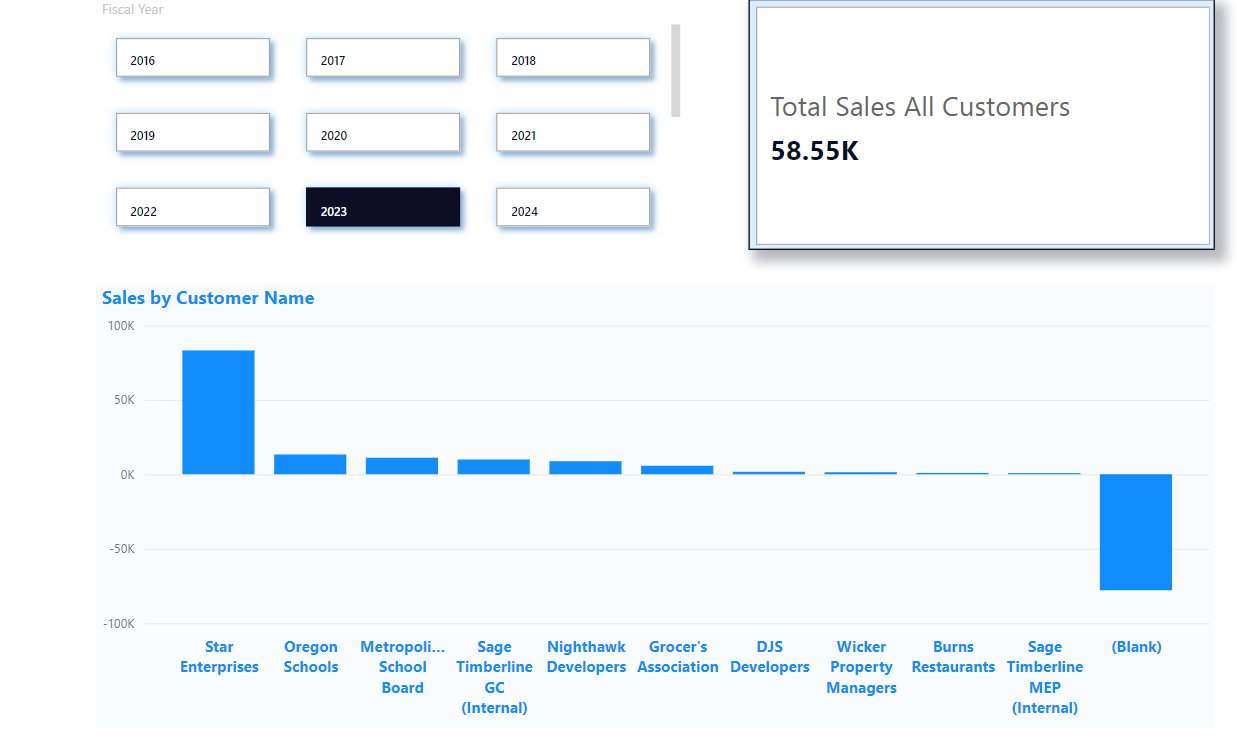
Here is an example of a report created in Power BI Desktop and published to the Power BI service.
Embed the Report in PowerPoint
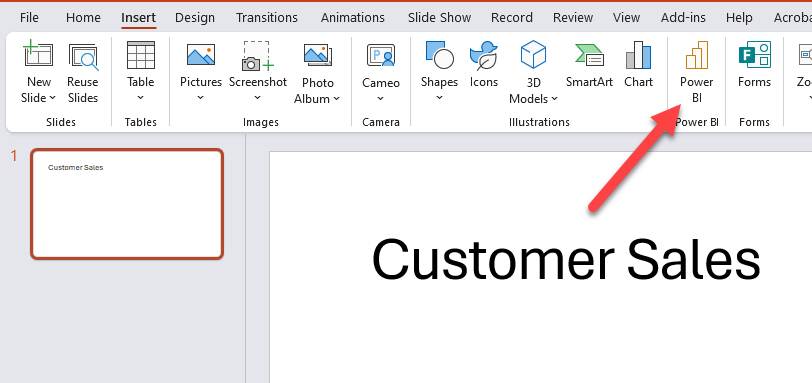
Create a PowerPoint presentation or add a slide to an existing one. Go to the Insert menu and select the Power BI button.
Once you select the button, you’ll see a box displayed with a place to enter a link.
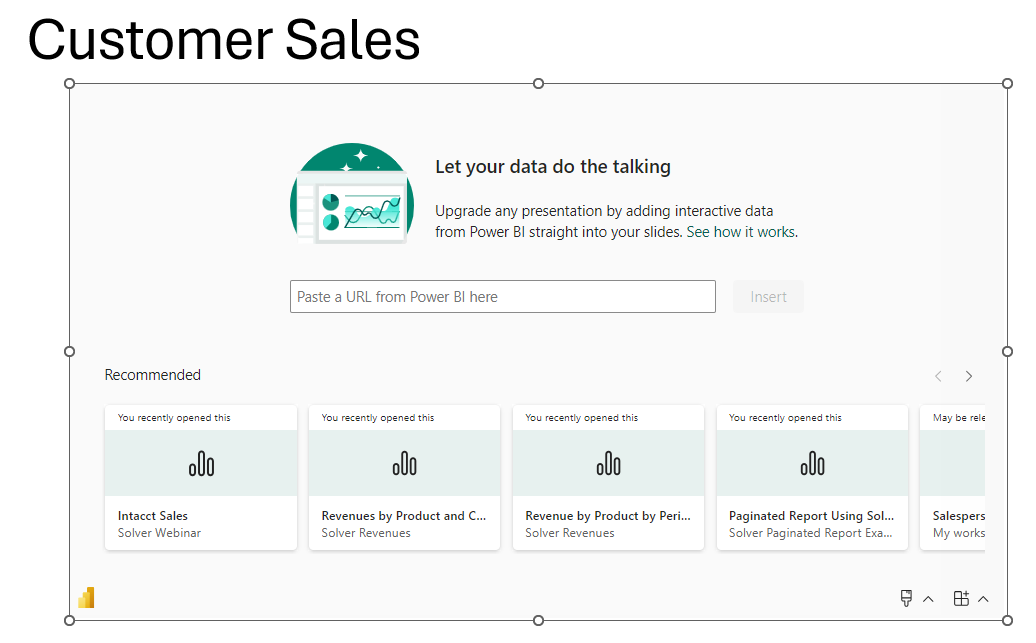
Go back to Power BI and copy the link or select one of the recent reports displayed.
You can select Main or Drillthrough.
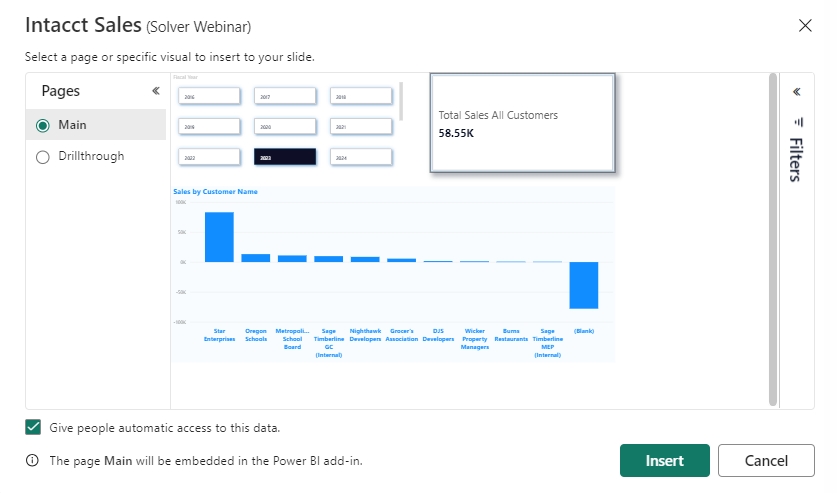
Select the Insert button and the report will appear.
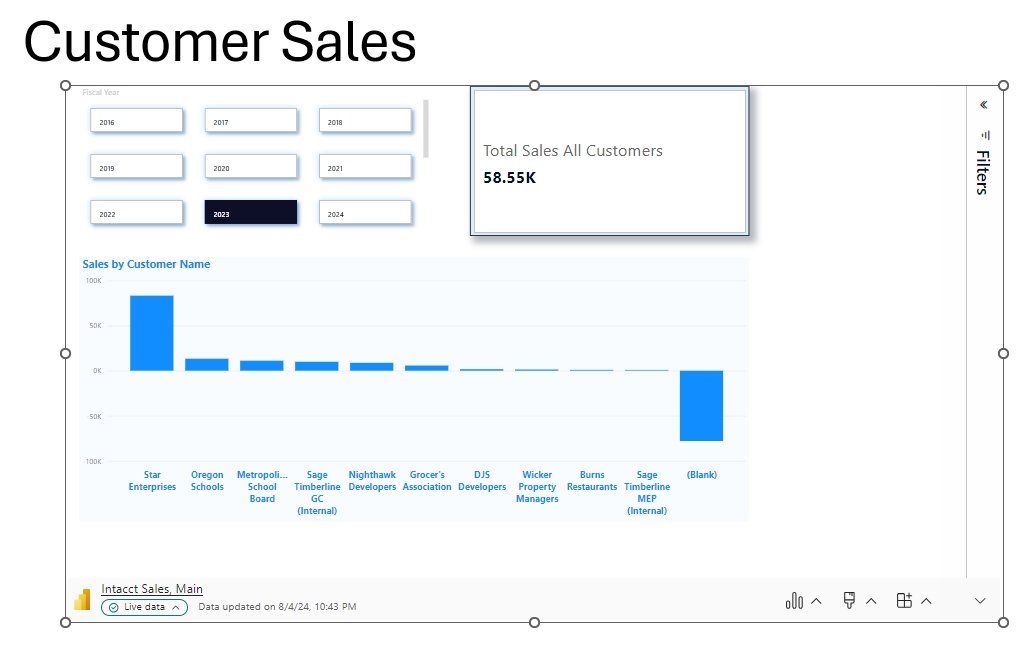
Notice the options at the bottom left and right on your screen.
If you select Live data, you’ll get a set of options.
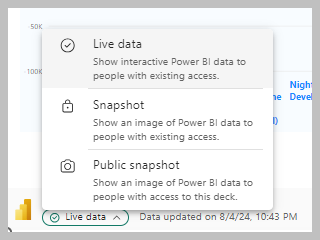
Depending upon how close to live data you want, select one of the options. The first option, Live data, gives users the ability to interact with the data. The users must be setup in Power BI with access to do so.
On the right side, there are multiple options, but this article is going to focus on two.
To see your options, select the first icon, which looks like a column chart.
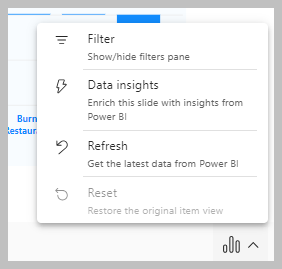
You can turn off the Filter pane, use data insights to ask questions and refresh the data.
The second item mentioned is the last button and the automatic refresh option.
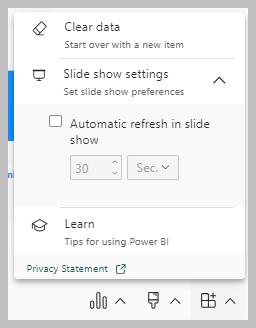
Note that the refresh option updates PowerPoint from Power BI. It does not update Power BI. Thus, if the data is not in Power BI, selecting refresh in PowerPoint will not pull data into Power BI. You must refresh Power BI from within Power BI.
In addition to the two items mentioned, you also have formatting and other options to consider.
Using the Power BI Report
Once the report is embedded in PowerPoint, you can use it, depending on your Live data settings, as you would if you were using Power BI. For example, in the report shown above, you can select one of the other buttons for the year to be displayed, and the report is updated. Instead of having to write down questions from curious meeting attendees, you can answer questions live.
Summary
This article has walked through the process of embedding a Power BI report in a PowerPoint slide. Using the Power BI option in PowerPoint, users can create presentations with live data connections, enabling them to ask and answer questions about the data on the fly.
Our technology consultants at Forvis Mazars can help you learn more about utilizing Power BI in PowerPoint to help you drive greater results in your business. Request a demo today to gain a deeper understanding of how Power BI can revolutionize your data visualization in presentations.