At Forvis Mazars, we’re committed to providing an Unmatched Client Experience® to our higher education clients, which is why we’re developing this Program Economic Analysis (PEA) use case series. In the first article, we provided insight into how you can use PEA to help analyze and plan for faculty line replacements. In this installment, we’re sharing how to use PEA data to re-evaluate your discount rate.
Ah, the discount rate—the enrollment management tool we all love to hate. There’s a lot of talk about how the cost of tuition and fees has increased substantially, but very little public acknowledgment that net revenue from tuition and fees has gone down. This is thanks, in large part, to the consumer-driven practice of awarding internal scholarships to admitted students in an attempt to entice their deposit. In private institutions, this practice is near-ubiquitous.
Here’s some sample data to start, from a small, private nonprofit institution.
- Enrollment has increased by 5.6%.
- Overall discount rate has risen from 30% to 36%.
- Net tuition revenue has declined, from $17.3 million to $16.7 million.
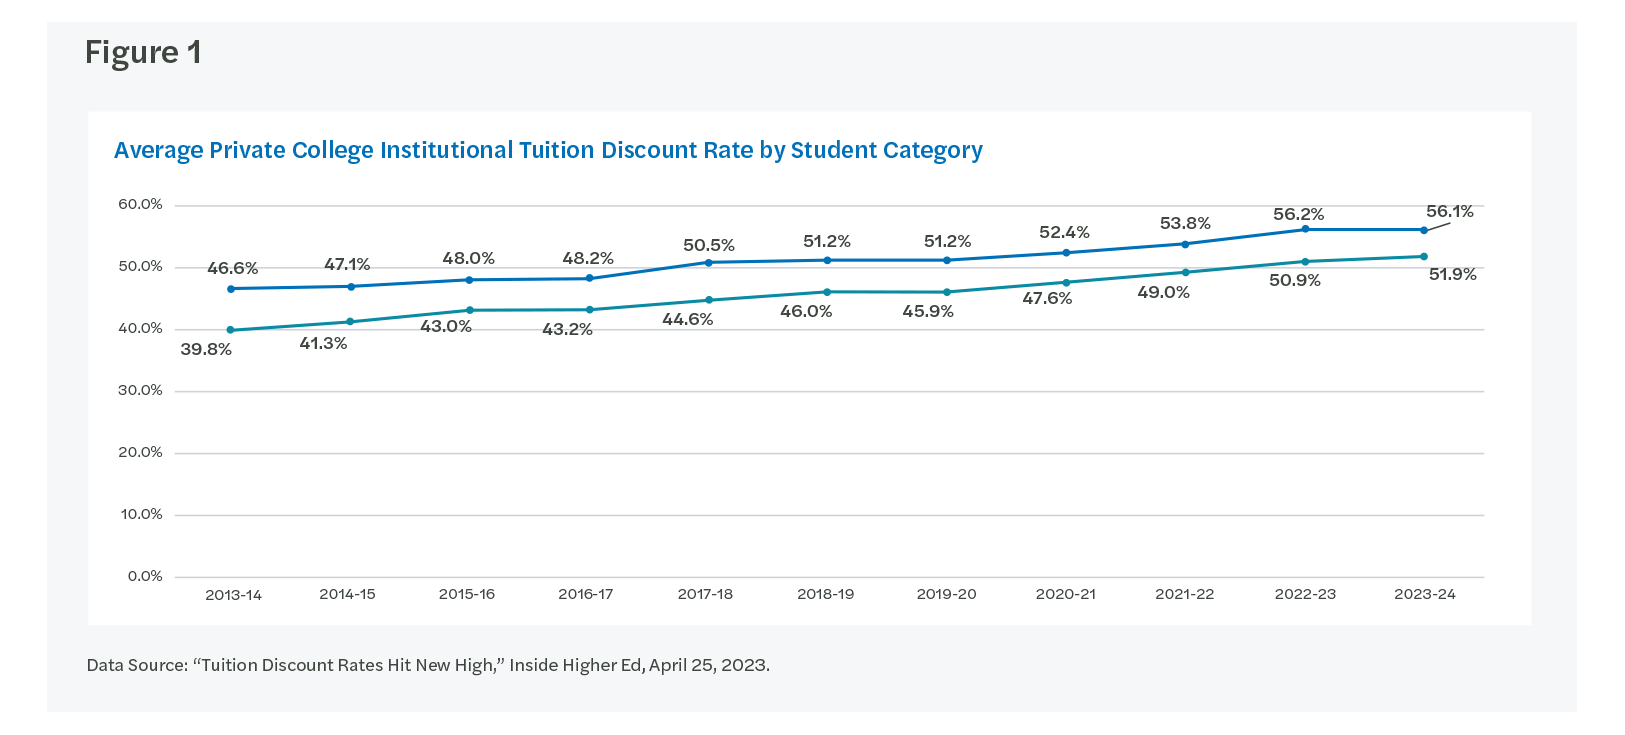
When we look at Figure 1, which represents all private nonprofit institutions in the U.S., we see that our sample institution’s story is not all that unique.
If this sounds like your institution, it may be time to think about where and how you’re using that discount rate. It’s going up and the effects might be counterproductive.
We find that most institutions track their overall discount and try to manage it accordingly. In reality, the rates differ by program. Did you know that PEA can help you identify those programs where the discount rate is working and where it’s not? Yes, there’s a dashboard for that! It’s called Program Tuition.
In the following example (Figure 2), the blue bars indicate enrollment in the major. Teal diamonds represent the discount rate (as a percentage of gross tuition and fees). We have filtered out student athletes, because the discount conversation there is quite different.
Enrollment in this program is steady (no new students over five years), but the discount has gone from 29% to 40%. It’s possible that enrollment would have declined if we hadn’t given students more aid. It’s also possible that we could have kept the discount rate at 29% or 30% and seen the same return, improving the net revenue of this program. In other words, is this a program where students would have chosen your institution anyway?
If you look through your own data, you may find more dramatic examples, such as programs where the discount rate has gone up by 10 percentage points, while enrollment has been halved. Could the discount rate have stayed the same and produced the same return?
A couple of caveats to close this edition:
- We aren’t suggesting you lower your overall discount rate (though, some institutions may benefit from this). We’re suggesting you take a look and see if there are programs where you can dial it back or crank it up to produce more net revenue.
- This kind of analysis will require you to understand students’ motivations for choosing your institution. If they’re expressing interest in a specific program that isn’t offered by any of your regional competitors, you may not need to hike up the discount.
- We understand that you have reasons for discounting other than enrollment growth. Keep doing those where they make sense and where they serve your mission.
There’s a lot of information you’d need to really study your discount rate, and while not all that information sits in PEA, we do offer a variety of complimentary services.
Contact Forvis Mazars to explore how our higher education consulting services can help you re-evaluate your discount rate.

 Click here to enlarge image
 Click here to enlarge image