Our investment banking team at Forvis Mazars Capital Advisors is uniquely positioned to observe and participate in current merger and acquisition (M&A) market conditions. As sell-side advisors, and based on our closings, we’re aware of market and transactional happenings across numerous industries. In this article, we’ll provide recent data and commentary related to middle-market M&A activity through the third quarter of 2024.
 Source: Pitchbook, Q3 2024 U.S. PE Breakdown Summary.
Deal Volume Commentary
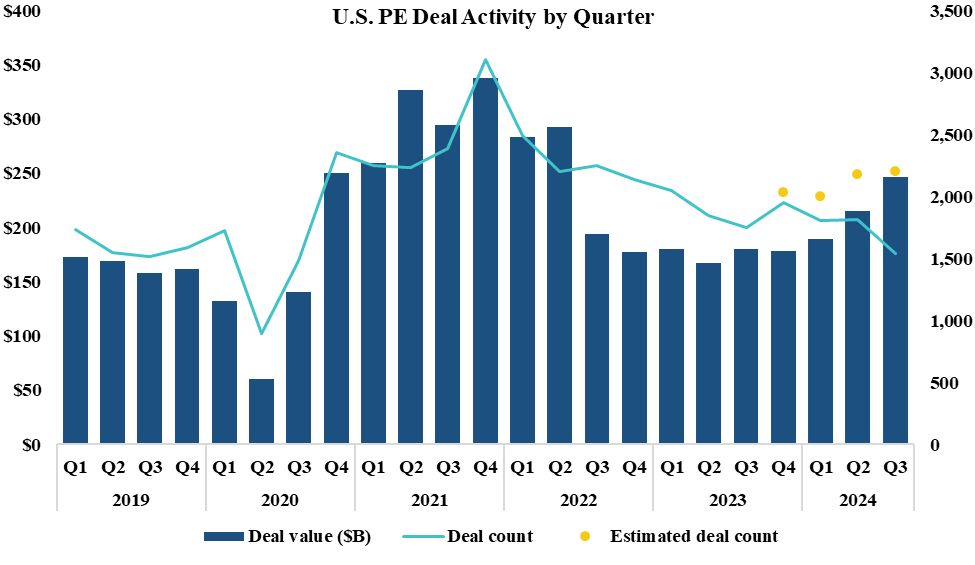
- After record-setting activities from Q4 2020 through Q2 2022, the M&A market languished through Q4 2023. 2024 offered renewed hope for an elevated market, but it developed more slowly than anticipated, primarily influenced by slower-than-expected interest rate cuts.
- However, the momentum that started to take hold in Q2 2024 continued its encouraging ascent in Q3 2024. Year-to-date deal volume for 2024 private equity (PE) deals is up 23% over the comparable 2023 level, with most of the deal volume increase occurring in the second and third quarters.
- Several factors are contributing to this activity uptick, including 1) strategic buyers—and private equity group (PEG)-backed, add-on buyers—being more creative in resolving valuation gaps; 2) sellers continuing to record favorable growth and earnings momentum; and 3) buyers feeling the confidence of lower economic risks and capital costs.
- Our firm is experiencing these same dynamics. Our 2024 second and third quarters were very solid, nearly matching activities in 2021. Furthermore, our pipeline of new engagement activity is encouraging, as we have numerous new transactions about to enter the market yet this year and into Q1 2025. We’re also encouraged by the market receptivity our client transactions are encountering in our current “in-market” engagements.
- Business-to-business (B2B) and IT-related transactions have generally accounted for about 50% of transactional volume combined; however, the volumes in these sectors are down slightly during the second and third quarters. Volumes were up in energy, financial services, and business-to-consumer (B2C) segments.
Valuation Metrics Commentary
 Source: Pitchbook, U.S. PE Deal Value by Size Bucket, as of September 30, 2024.
 Source: Pitchbook, Median U.S. PE Buyout EV/EBITDA Multiples, as of September 30, 2024.
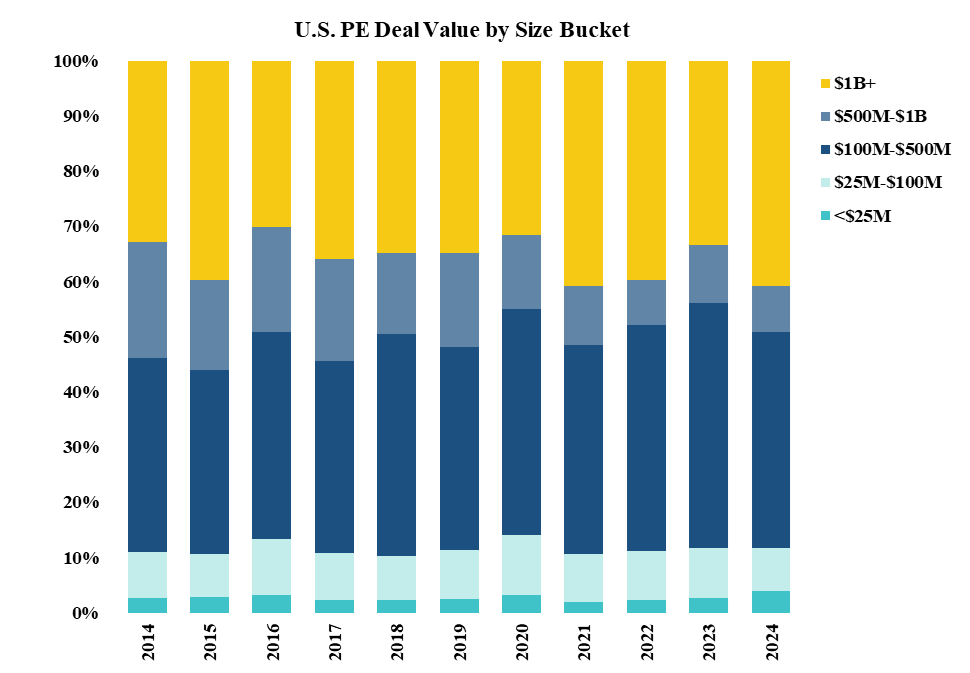
- As presented in the deal size matrix, more deals in the U.S. in 2024, relative to 2022 and 2023, were above $500 million. This segment accounted for 49% of total transaction value in 2024, and this weighting of larger deals had a material impact on transaction multiples. To put this in perspective, deals of $2.5 billion or greater have an enterprise value-to-revenues multiple of 4.2X—trailing 12-month (TTM), as of September 30, 2024 for North America and Europe—while the same ratio for deals less than $25 million is 0.8X.
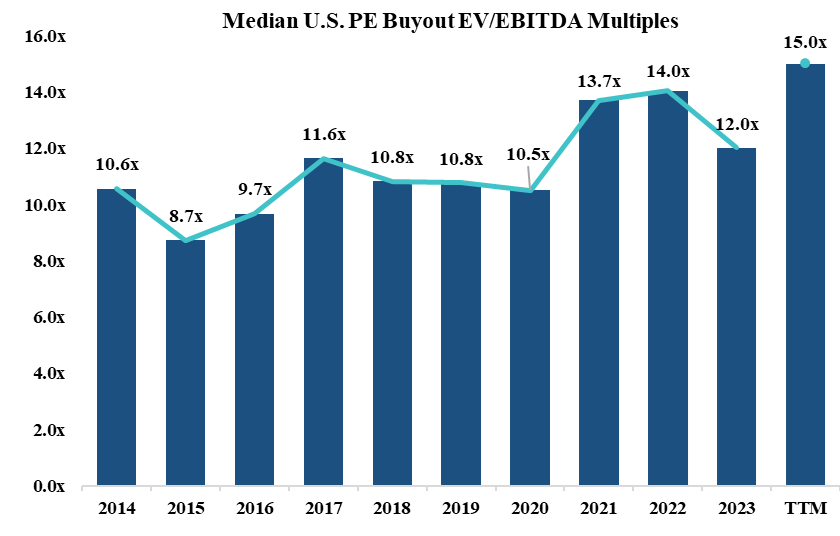
- In essence, transaction size can be critical, and one needs to consider this when assessing transactional valuation multiples. The above table, “Median U.S. PE Buyout EV/EBITDA Multiples,” presents the median enterprise value/earnings before interest, taxes, depreciation, and amortization (EV/EBITDA) multiples over the past decade. The average deal size is over $1 billion in 2024, while it was less than $700 million in 2023. This size differentiation is a critical factor in the out-sized valuation multiple of 15.0X for the TTM period ending September 30, 2024, compared to the longer-term average of about 12.0X (recorded in 2017–2023).
- Since few of our firm’s clients are recording billion-dollar transactions, we tend to rely on our transactional experiences and other lower middle-market data points to gauge valuation dynamics. We’re most often involved in transactions in the $25 million to $500 million levels, and while it can be very industry- and circumstantial-driven, we’re often finding current EV/EBITDA multiples in the 6.0X to 7.5X range for transactions less than $50 million and in the 8.0X to 10.0+X range for valuations in the $100 million to $250 million level. Our overall experience is that lower middle-market valuations peaked in 2021, and then generally declined by about 10% to 20% as costs and risk considerations evolved. Our data points suggest that the average EV/EBITDA multiples have been relatively stable in the 7.0X to 7.5X range during the past two years for transactions less than $500 million, although we’ve seen some signs of multiples edging upward. Of course, top-performing companies in predictable and/or high-growth industries typically garner premium valuations, often several turns about industry averages.
If you have any questions or need assistance, please contact a professional at Forvis Mazars.
