
Understanding your target audience’s demographics can be crucial with businesses looking to venture into a new market, boost funding allocation, and refine their marketing effort. When used effectively and combined with other data, e.g., behavioral, transactional, operational, geographic, and attitudinal data, demographic analysis can reveal a comprehensive picture and provide in-depth insight into your target population. Discovering factors like age, gender, ethnicity/race, marital status, family size, income, education, home ownership, occupation, and geolocation can provide consequential insights into your audience’s interests, choices, purchase habits, and patterns.
Age
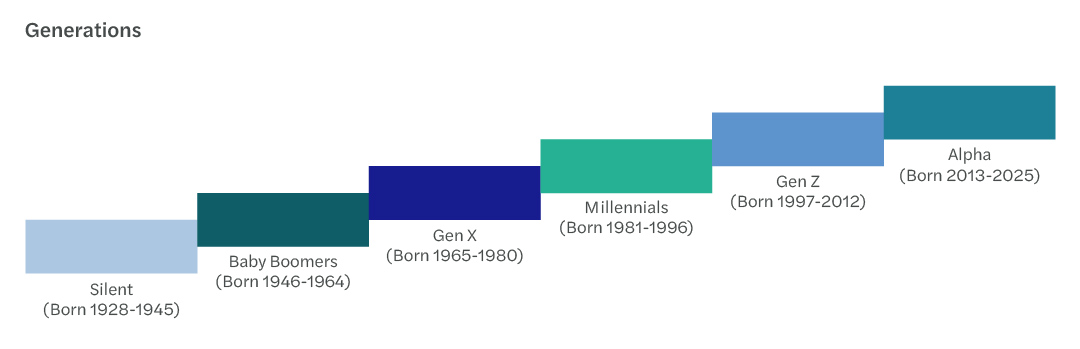
As people age, their needs may evolve. These evolving needs can impact people’s buying habits. Here are a few ways that age can affect behavior:
- Different digital and technology adoption speeds: Older consumers may adopt technological changes at a slower speed than younger generations, which may influence how they connect with online shopping platforms and interact with digital advertisements.
- Healthcare needs: With age, people’s healthcare needs change. Younger generations may purchase a high-deductible health plan (HDHP), while older generations may opt for a preferred provider organization (PPO) health plan. Younger families may seek a network of pediatricians and specialists, middle-aged families may search for general or internal medicine, and older generations may compare nursing home star ratings and qualities.
- Preferences, choices, and selections: Different age groups have unique preferences, and each group has distinct selections that shape their purchasing decisions. For example, younger shoppers may rank innovative products higher, and older customers may emphasize practicality.
Examples include:
- Pediatrician offices may leverage the region’s children population growth (Age 0–17) to expand their practices’ footprints
- Digital and online retailers may create consumer groups based on age level.
- Fashion clothing businesses may allocate most of their marketing and promotional resources to the wealthy and affluent populations aged 45–64 who live in an urban area.
Gender
Companies have done in-depth research to study gender differences, providing evidence on how men and women make purchase decisions differently.
For example, men may focus on functionality, operability, and practicality, while women may pay more attention to artistic design, visual attractiveness, and style. Recognizing these differences allows companies to tailor their product offerings further. When positioned strategically, gender-driven marketing efforts can be productive and efficient.
Examples include:
- OBGYN clinics study female population projections before opening new clinics.
- Female products are typically more expensive than male products, including clothing, toys, skincare products, personal care items, etc.
- When evaluating color distinctions, ladies’ skincare products are never in deep shades of blue, while diaper packaging is in light colors.
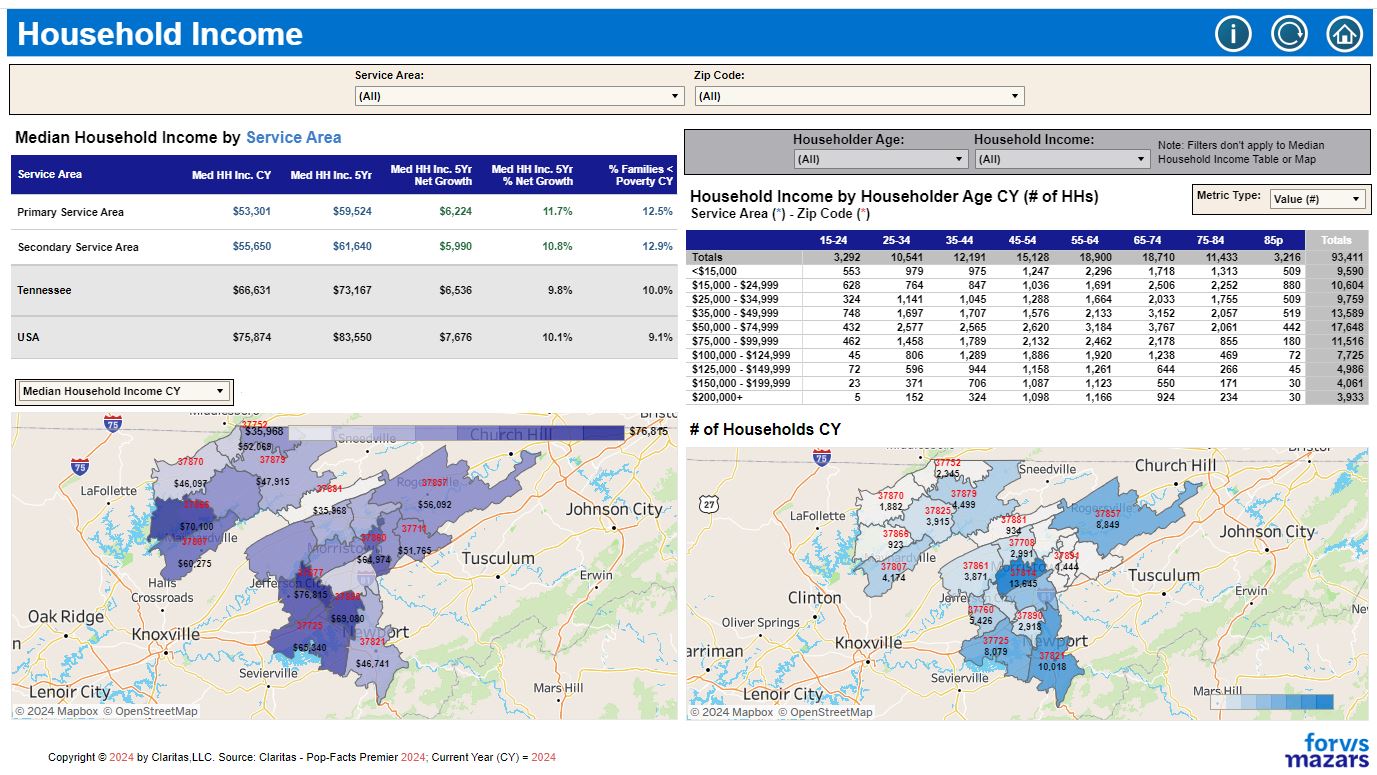
Income
Recognizing different income levels of a specific target audience can help companies set their prices. When individuals or households generate higher incomes, they have more surplus income for monthly expenditures. In contrast, if income shrinks, they will more than likely reduce spending.
Examples include:
- Economical and high-end apartments generate different types of campaigns based on various income levels.
- Private schools and public schools may advertise differently for financial aid and scholarships, unique class sizes, research opportunities, etc.
- High-performance vehicles may include premium interior design, enhanced safety features, and upgraded suspension and engines.
Combining income levels with age groups, along with geolocation data (ZIP code, state, and region) can provide deeper insights, which can allow companies to convert the numbers into actionable results and build their brands more effectively.
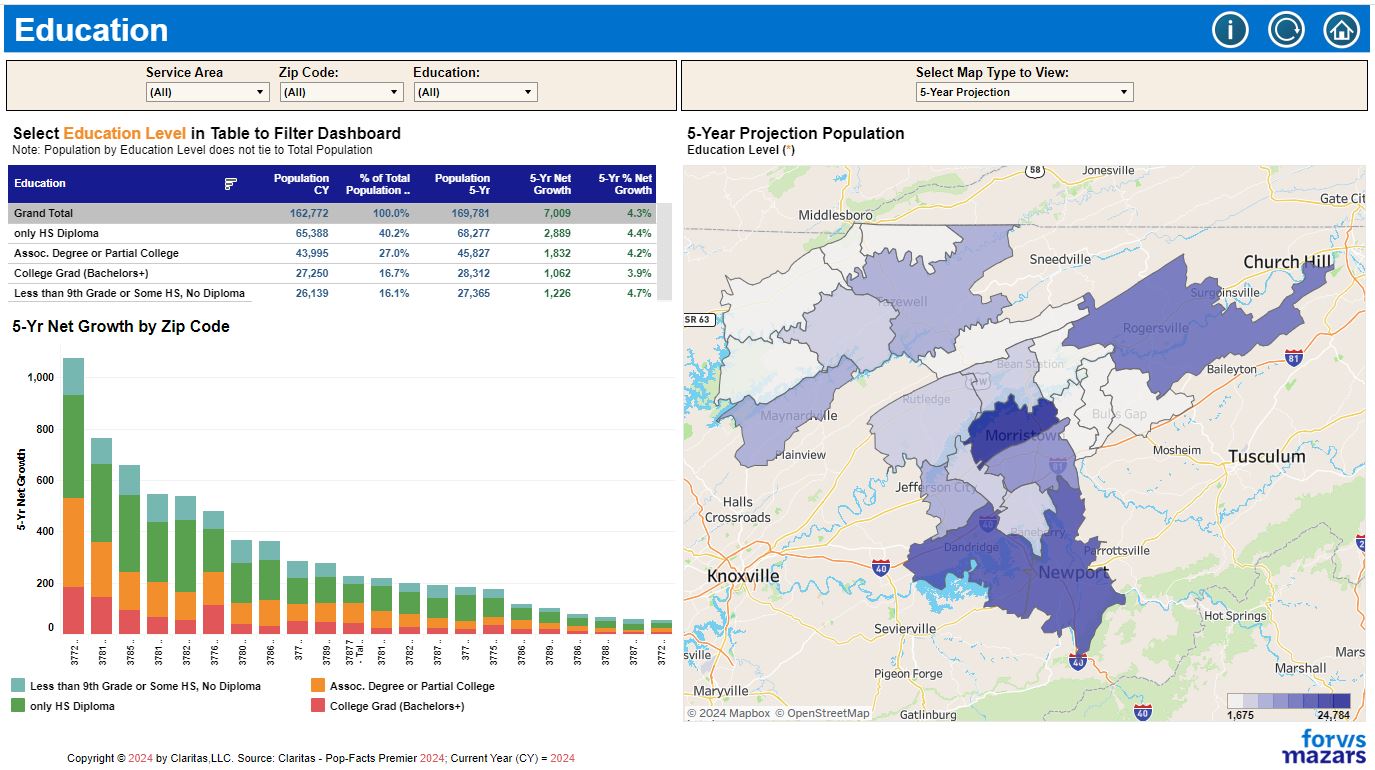
Education
Companies can learn about a target audience’s educational backgrounds to connect with them by appealing to their intellectual focus. This customized approach can increase the level of engagement and create a deeper connection between the brand and potential customers.
An example includes:
- A digital learning platform might emphasize different pathways to attract consumers with various educational backgrounds.
Occupation
Occupation provides insights into different career-oriented lifestyles. Companies create products and services to match the needs associated with specific occupations.
Examples include:
- Sports companies might create different business lines, considering various athletic preferences.
- Work-from-home professionals may seek ergonomic furniture, while construction workers might prioritize durable gear.
Geographic Location
Companies can tailor services based on area and regional preferences, climate, and cultural influences.
Examples include:
- To appeal to environmentally conscious shoppers, electric vehicle (EV) companies may focus on sustainability.
- A skincare company may emphasize protection of ultraviolet (UV) light for a southern region, while a ski jacket retailer may target audiences from colder climates.
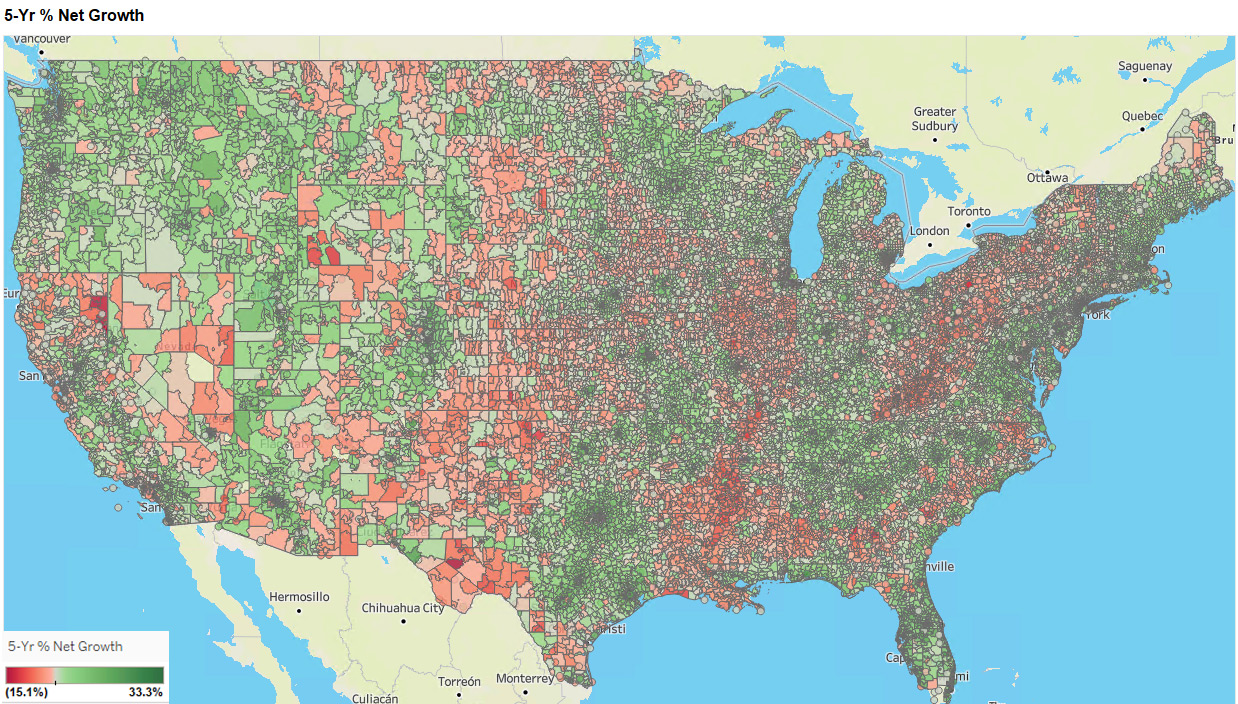
- By studying in-migration and out-migration patterns in a ZIP code basis, we can predict population growth in state, regional, county, and ZIP code levels.
How Forvis Mazars Can Help
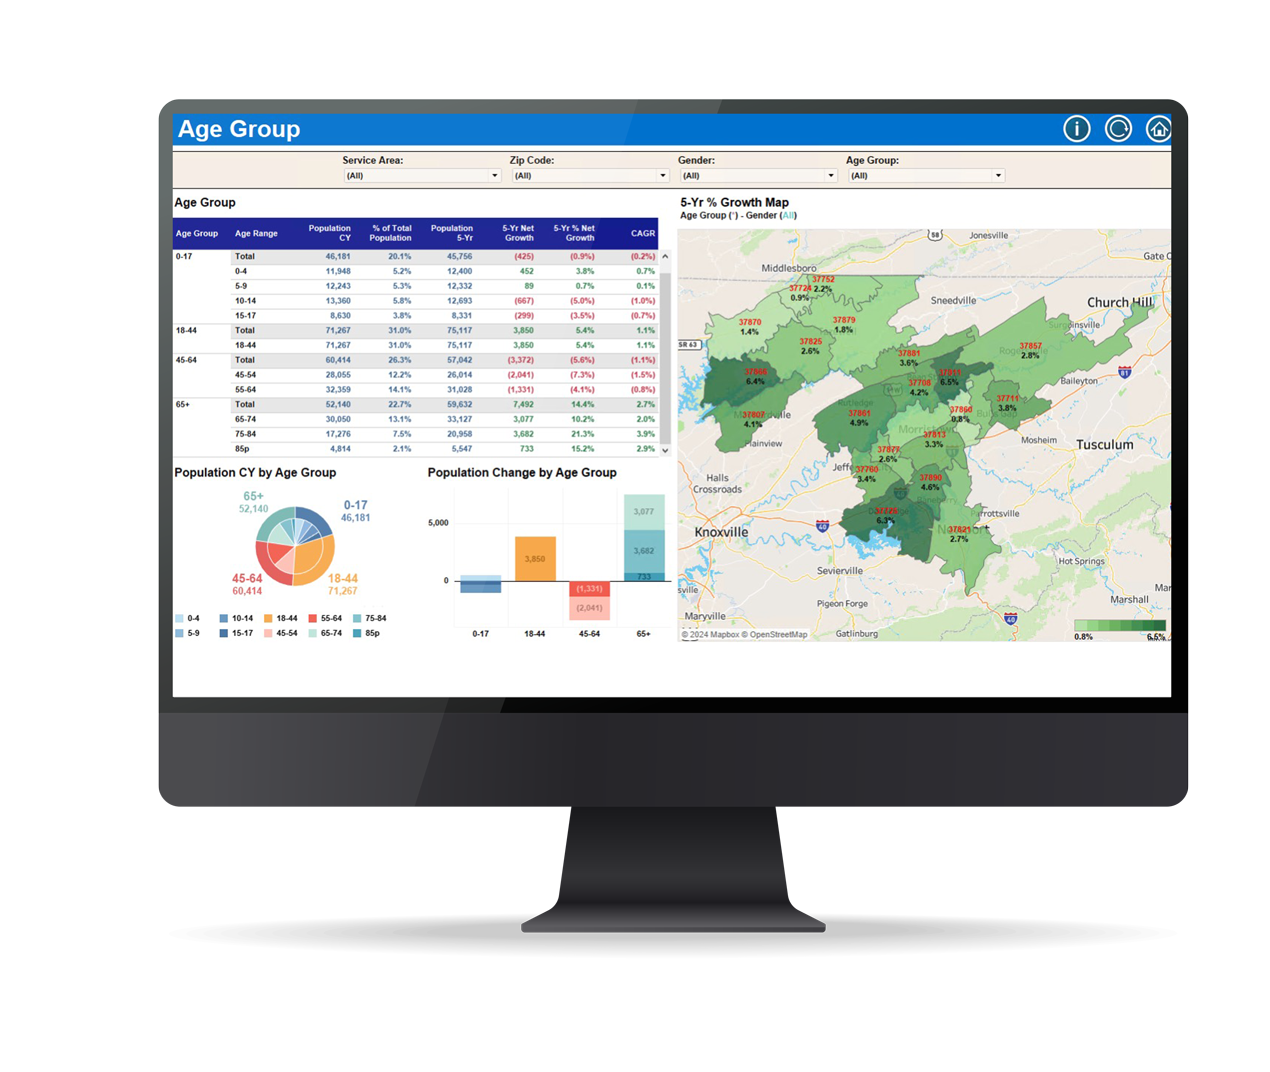
Our data analytics team at Forvis Mazars has the tools in place to provide clients with current-year and five-year projections through demographic analysis.1 By utilizing our qualitative demographic data, you can better understand population trends, age distribution, income levels, ethnicity/race, marital status, family size, home ownership, and educational attainment, potentially benefiting your business through data-driven decisions.
Ready to gain deeper insights from your target audience through an in-depth demographic and forecast analysis? View our demographic analysis demo site for more or contact a professional at Forvis Mazars for a demo today.
- 1Based on Claritas Pop-Facts U.S. Census, American Community Survey (ACS). The data set also provides data for the 2010 and 2020 census years for current-year geographics.