
In the complex landscape of providing services to the disabled, understanding your cost report data and how it relates to reimbursement is more important than ever. Further, in the highly competitive New York State (NYS) operating environment, Consolidated Fiscal Report (CFR) benchmarking stands out as a critical resource for evaluating the financial and operational performance of your agency and benchmarking it to providers of similar services.
The CFR captures detailed financial and nonfinancial data, including—but not limited to—revenues, expenses, units of service, staffing hours, contracted services, and related-party transactions, and is filed by all providers of intellectual and developmental disabilities and behavioral health (IDD/BH) and special education services in NYS. This level of detail provides stakeholders, including government agencies, regulators, service providers, and the public, transparent access to the financial information of providers, fostering trust and confidence in the sector. Further, and more importantly, the information reported on the CFR is directly or indirectly used to set reimbursement amounts.
Through the Freedom of Information Law (FOIL), Forvis Mazars has obtained the June and December CFRs filed with NYS for more than 10 years. Using this data, Forvis Mazars built a tailored IDD/BH CFR Benchmarking Analysis Tool that summarizes the information in a meaningful way. The Benchmarking Analysis Tool allows users to navigate information for both their organization and other similar providers. If used appropriately, this information can give the user insights into their operations and provide a tool to help identify potential expansion opportunities.
Each provider faces its own set of challenges similar to other providers in the field. These challenges include staffing shortages, cost increases over trend factors, insufficient property reimbursement, reductions due to rate methodology reimbursement screens, and many others. Data and benchmarking are the key to understanding how competitive you are with similar providers and potential reasons for losses and/or anomalies in your operations.
Here are some ways that the IDD/BH CFR Benchmarking Analysis Tool from Forvis Mazars can help with providers’ challenges:
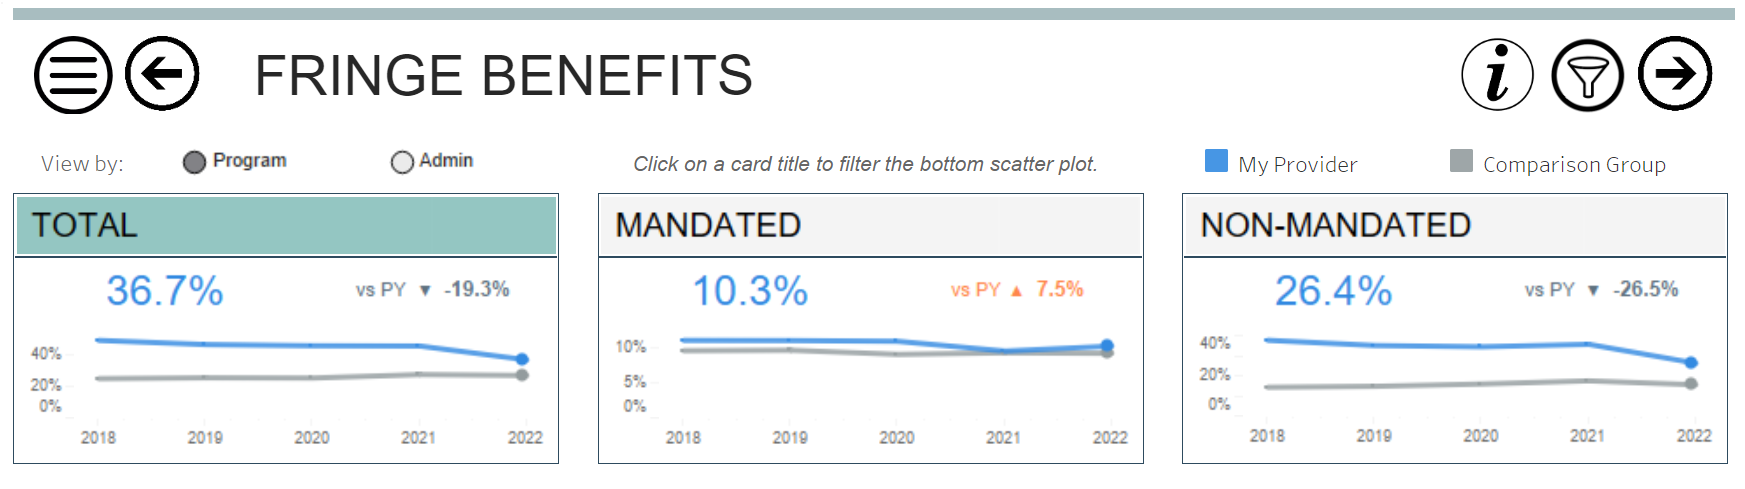
Hiring Strategies
The Fringe Benefit and Salary Dashboard can be useful when assessing your organization’s competitiveness in the hiring space. Understanding how your employees’ compensation rates and fringe benefit percentages compare to other providers can help you to understand and potentially make high-impact adjustments in hiring practices to attract and/or retain employees.
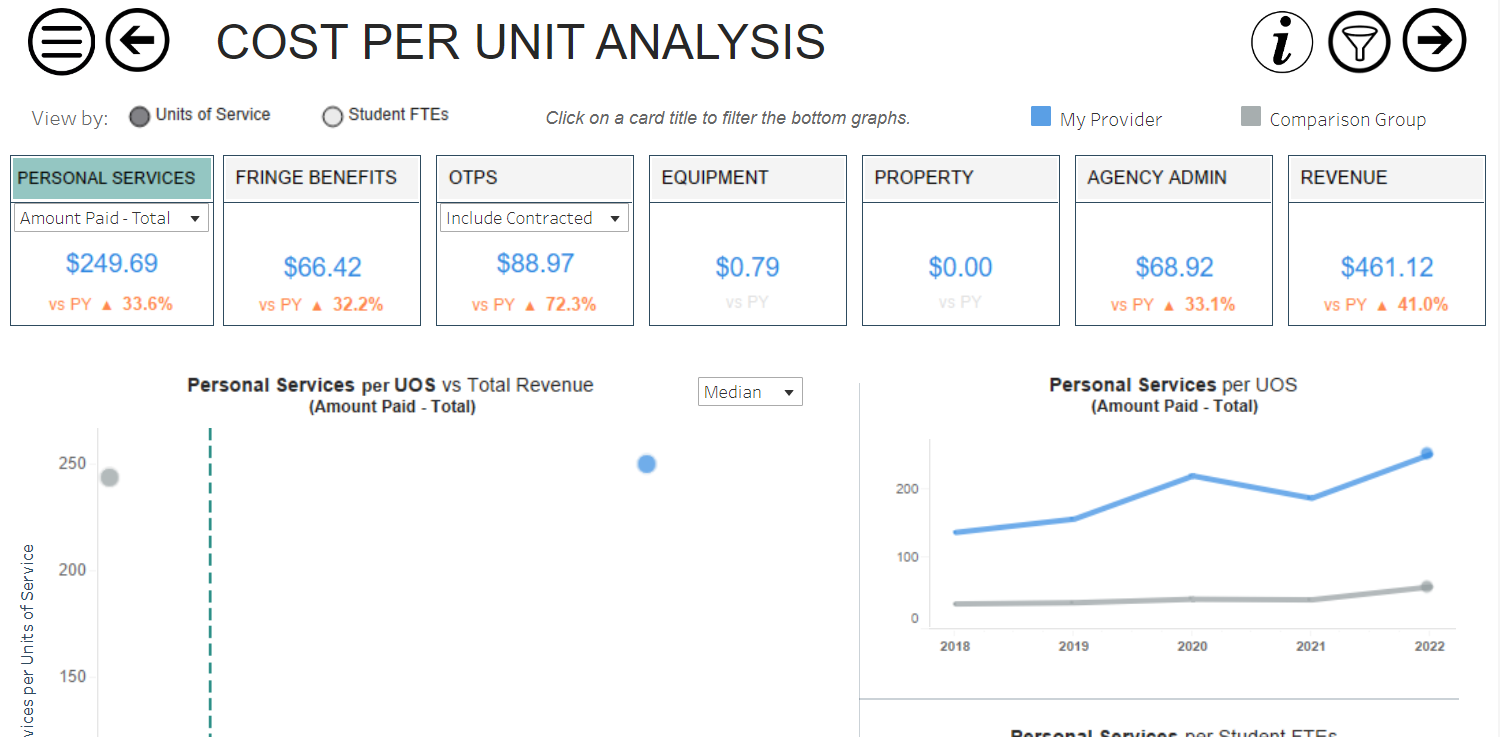
Spending Strategies
The Per Unit of Services Per Category Dashboard can be useful to identify your organization’s spending patterns over multiple years, as well as compare with peers to identify if you are an outlier in that area of spending and help identify changes and possible improvements.
The Office for People With Developmental Disabilities (OPWDD) Brick Analysis Dashboard allows OPWDD providers to compare the Rate Rationalization Program Actual Bricks from the CFR to Bricks from the rate sheets to gain insight into why your programs are gaining or losing money in specific years and to help adjust spending in the future.
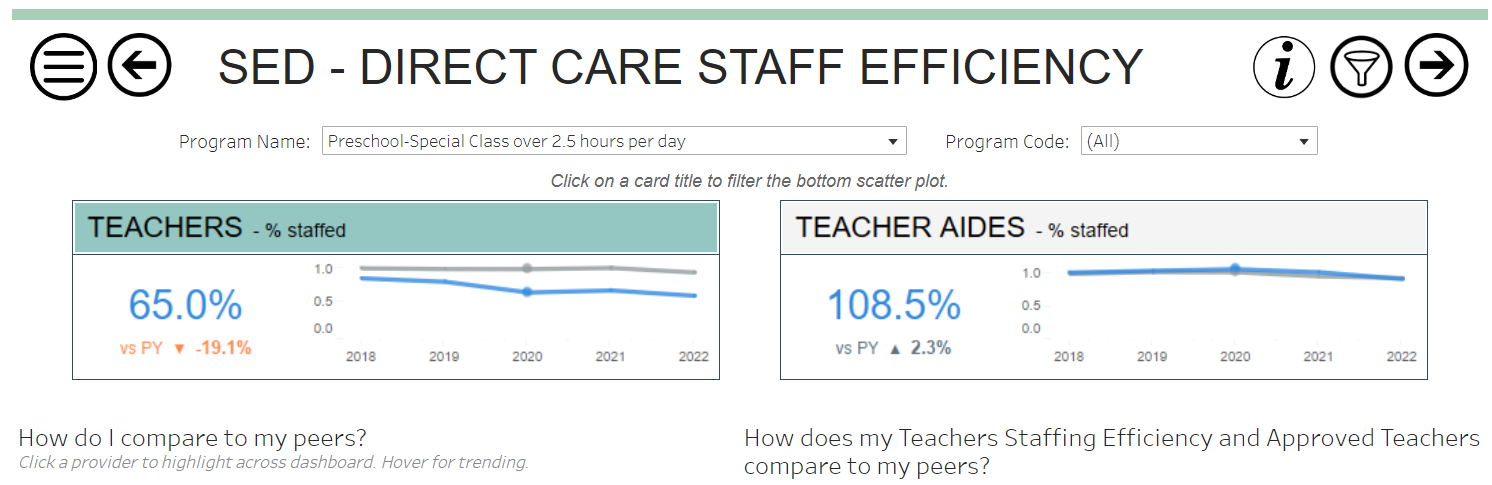
Operational Strategies
State Education Department (SED) Enrollment Efficiencies, SED Direct Care Staff Efficiencies, and SED Clinical Efficiency dashboards provide insight into some of the most important operational factors for SED providers. The analysis can help support future management decisions, such as changes in the number of classrooms and increases or decreases in teaching and clinical staff to achieve both compliance and efficiency with state mandates.
Overall Agency Strategies
Program expansion, program closures, mergers and acquisitions, and agency collaborations are common in the IDD/BH and special education field. The Financial Health Dashboard provides major key performance indicators for each provider’s overall financial operations.
The Program and Profit Losses Dashboard allows users to navigate to the program/provider/county level to understand financial performance for specific programs. Both of these dashboards can help management narrow down areas of focus for review and/or change.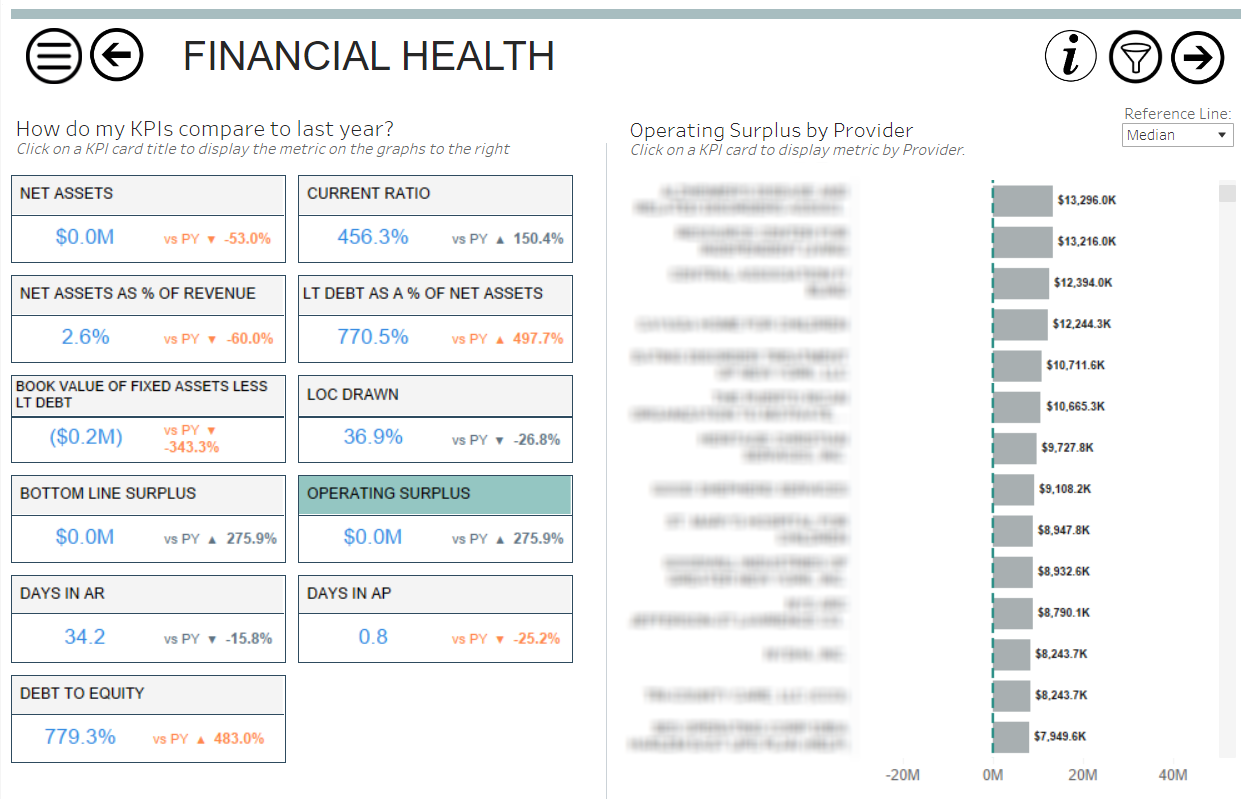
Conclusion
NYS IDD/BH and special education providers are dedicated to providing essential care and support to individuals with diverse needs. The CFR Benchmarking Analysis Tool offers an in-depth approach to help providers improve the understanding of the financial data reported for their programs, benchmark to peers, and identify areas of improvements that can potentially result in more efficient and cost-effective services for individuals they serve.
If you have any questions or are interested in learning more about our CFR Benchmarking Analysis Tool, please reach out to a professional at Forvis Mazars.