
Background
The single largest impact on profitability calculations in your loan pricing model is the funds transfer pricing (FTP) rate. Some community bank commercial lenders and credit analysts generally are unfamiliar with the importance of FTP concepts and methodologies and how it figures into the lending process. Members of the finance team are often tasked with maintaining in-house FTP systems for their institutions, sometimes at the exclusion of lenders and credit personnel.
At the most basic level, FTP determines the net interest margin of each individual account being analyzed for profitability. This includes the assignment of a cost of funding (COF) rate to asset products and a credit for funding (CFF) rate to liability and capital products. Because these rates—and the resulting interest income and interest expense assigned to individual products—do not appear on an institution’s income statement, a valid FTP allocation model needs to be defined so the total COF applied to assets equals the total CFF applied to liabilities and capital.
| Interest Income | Interest Expense | Margin | |
|---|---|---|---|
| Assets | 5.50%* | 3.25%** | 2.25%† |
| Liabilities & Capital | 3.25%** | 2.00%* | 1.25%† |
| Yield/Cost Spread | 5.50%* | 2.00%* | 3.50%* |
- *Results as reported in institution’s financial statements
- **Weighted average FTP rates
- †Margin contribution
It is only through a methodology such as this that an accurate profitability contribution can be calculated for each individual account. Within your pricing model, once the profitability of each account is determined, relationship profitability can be easily calculated by aggregating totals of individual accounts in the relationship.
The most important FTP concept to understand is that not all accounts are assigned the same FTP rate. The FTP rate is based on both the duration of the account and the rate environment at the time the account is originated or has a rate reset. Usually, an institution determines a single FTP curve to apply to its FTP modeling. Most often, these are market-based curves such as U.S. Treasury, federal home loan bank borrowing, or Secured Overnight Financing Rate/swap curves. Other institutions might decide to use an internal FTP curve based on their current CD offering rates.
COF Loans
The FTP rate assigned to loans is called the COF rate and is based on the term of the loan. Floating rate loans that have an overnight rate change frequency have a COF assigned from the shortest end of the FTP curve while longer-term fixed-rate loans are assigned a COF from a point farther out on the FTP curve. Depending on an institution’s current balance sheet mix and its long-term goals, a liquidity premium or discount can be added to the market funding curve, resulting in an adjusted FTP curve.
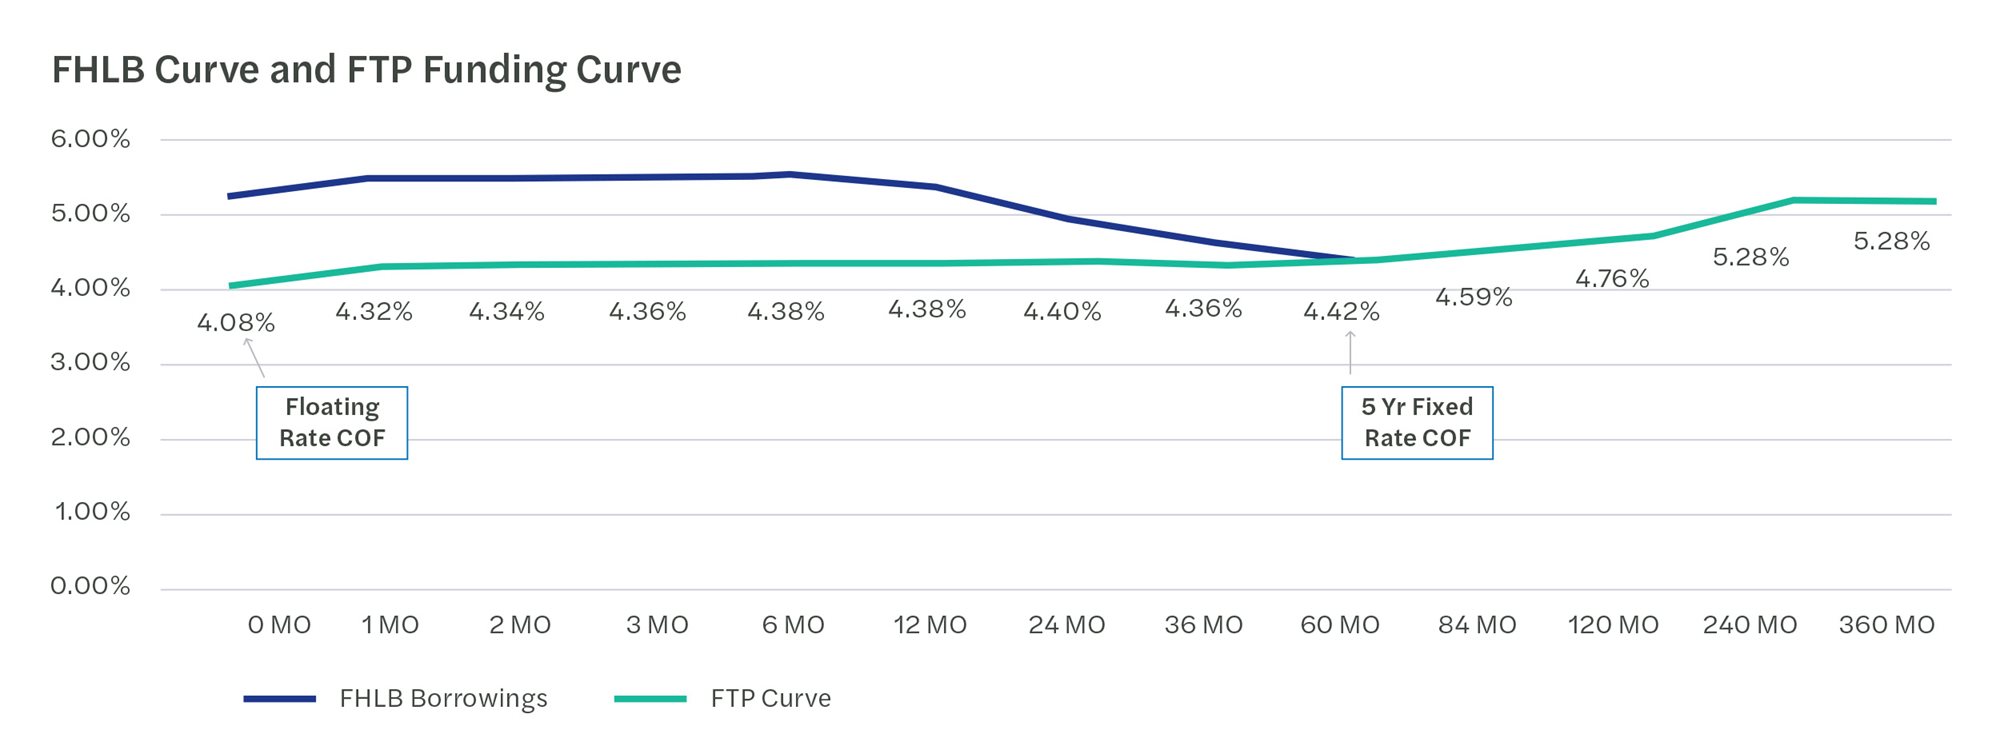
- FHLB curve and FTP funding curve
- FTP Curve
- 0 month - 4.08%
- Floating Rate COF
- 1 month - 4.32%
- 2 month - 4.34%
- 3 month - 4.36%
- 6 month - 4.38%
- 12 month - 4.38%
- 24 month - 4.40%
- 36 month - 4.36%
- 60 month - 4.42%
- 5 Yr Fixed Rate COF
- 84 month - 4.59%
- 120 month - 4.76%
- 240 month - 5.28%
- 360 month - 5.28%
- 0 month - 4.08%
- FHLB Borrowings
- 0 month - 5.33%
- 1 month - 5.57%
- 2 month - 5.59%
- 3 month - 5.61%
- 6 month - 5.63%
- 12 month - 5.48%
- 24 month - 5.00%
- 36 month - 4.66%
- 60 month - 4.42%
- 84 month - 4.59%
- 120 month - 4.76%
- 240 month - 5.28%
- 360 month - 5.28%
Therefore, the loan rate required on longer-term loans is generally higher than shorter-term loans to achieve the same margin and, ultimately, the same profitability and return on equity (ROE). Of course, this does not include risk rating and other factors that ultimately impact a loan’s profitability.
COF Methodologies
Due to the amortizing nature of many loans, most loan pricing models allow the COF calculation to be adjusted based on different methodologies discussed below.
Coterminous Maturity Matched – The COF rate is assigned based on how long the loan rate is fixed for with no adjustment for principal paydowns. A five-year fixed-rate loan receives a five-year COF rate derived from the FTP curve.
Duration Cash Flow Method – The duration of the loan is first calculated based on the fixed term and the amortization period. The COF rate is then assigned from the point on the FTP curve that matches this duration. A five-year fixed-rate loan with customary principal and interest payments amortizing over 15 years has a duration of approximately 4.6 years.
Coterminous Cash Flow Method – Each principal payment is assigned a COF rate based on the month that payment is made. The first month’s payment receives a one-month COF rate, the second month’s payment receives a two-month COF rate, and so on. A weighted average of the principal amounts and COF rates is then calculated. The results of this method are like the duration cash flow method.
CFF on Deposits
The FTP rate assigned to deposits is called the CFF rate and, like loans, is based on the term of the account. This is straightforward for term time deposits. The CFF rate is applied based on the term of the CD and the date the bank rate was set on the CD. This is either the origination date or last renewal date.
Non-maturity deposits are somewhat more complex since they have no stated term or maturity. The best method to apply a CFF rate to these accounts is based on the average life or duration. Often, this data can be gathered from results of the institution’s non-maturity deposit decay studies. Once that data is gathered, the CFF rate is determined based on a schedule like the following:
| Contractual Term | Average Life | Duration | CFF Rate | |
|---|---|---|---|---|
| NIB DDA | 0 years | 6 years | 3 years | 1.96% |
| IB DDA | 0 years | 4 years | 2 years | 2.77% |
| MMDA | 0 years | 2 years | 1 year | 4.31% |
| SAVINGS | 0 years | 8 years | 4 years | 2.10% |
The CFF rate is then calculated by evaluating the average rate at the point on the FTP curve that matches the duration of the product over a period that also matches the duration of the product. As an example, the savings account with a four-year duration would receive a COF rate based on the average four-year FTP curve rate over the last four years.
Summary
There are many assumptions that impact the profitability and ROE calculations in loan pricing models. Factors such as account size, product costs, provision expense allocations, and capital allocations are just a few variables. The FTP methodology trumps all other profitability assumptions. Having an in-depth understanding of this key driver of profitability is essential to help successfully implement a loan pricing model. Visit the LoanPricingPRO® page to learn more about our loan pricing model platform.
If you have any questions or need assistance, please reach out to a professional at Forvis Mazars.