Introduction
Monthly recurring revenue (MRR) is a gold standard metric in the analysis of software, tech-enabled services, telecommunications, and other subscription-based businesses and generally represents contractual revenue for ongoing services where the customer derives benefit on a monthly basis. A robust recurring revenue base can illustrate stability in a company’s top-line revenue and is often a key value driver for investors deploying capital in the space.
Savvy investors know that understanding the composition of the recurring revenue base and related trends is a critical component of the financial due diligence process. Investors and corporate finance teams that rely exclusively on quality of earnings (QoE) might be missing trends in key business drivers that could materially impact adjusted EBITDA, business valuation, and the decision to invest.
Whether you are looking to attract investors or are contemplating an acquisition, expanding the scope of work to include certain business diligence procedures can drill down into the finer points of MRR and uncover the rich data below the surface of the QoE, creating an opportunity to respond to new information quickly and early in the overall deal process.
Does Your Revenue Really Show Growth?
Analysis of MRR alongside the QoE is nothing new; however, scoping these procedures out of the financial due diligence process can disconnect your trusted deal advisor and its analytics team from this important data. Calculating annual recurring revenue (ARR) using under-examined MRR could yield a result that aligns revenue growth with an investor’s thesis but obscures a trend related to pricing, usage, sales mix, and customer size or profitability that would never get past an investment committee.

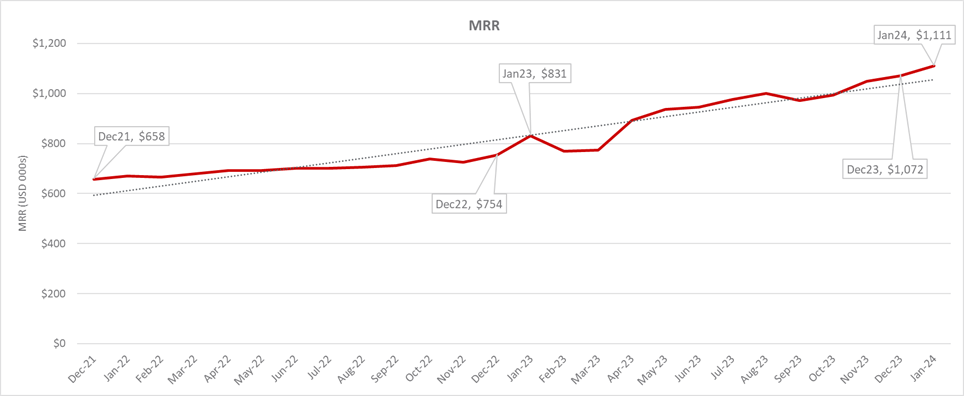
For example, consider a confidential information memorandum (CIM) that includes a line chart presenting a strong and steady growth trend in a company’s MRR over the last three years. On the surface, this could appear to meet the investment thesis criteria focused primarily on predictable cash flows stemming from long-term contractual monthly services. But what if there is more to the story than meets the eye?
Why Thorough Analysis Matters
| MRR & Customer Roll | MRR | Customers | Avg MRR/Customers | ||||||
|---|---|---|---|---|---|---|---|---|---|
| US$ in 000s, customers actual | FY22 | FY23 | LTM24 | FY22 | FY23 | LTM24 | FY22 | FY23 | LTM24 |
| MRR roll | |||||||||
| Beginning MRR | 658 | 754 | 893 | 110 | 115 | 113 | 5,981 | 6,556 | 7,900 |
| New customers | 43 | - | - | 10 | - | - | 4,266 | NQ | NQ |
| Net upgrade/downgrade | 87 | 429 | 295 | NA | NA | NA | NA | NA | NA |
| Churn | (33) | (111) | (100) | (5) | (11) | (10) | 6,687 | 10,134 | 9,998 |
| Ending MRR | 754 | 1,072 | 1,087 | 115 | 104 | 103 | 6,556 | 10,305 | 10,556 |
| MRR/customer churn | (5.1) | (14.8) | (11.2) | (4.5) | (9.6) | (8.8) | NA | NA | NA |
| Growth rate | 14.6 | 42.1 | 21.8 | 4.5 | (9.6) | (8.8) | NA | NA | NA |
| Net renewal rate | 108.1 | 142.1 | 121.8 | NQ | NQ | NQ | NA | NA | NA |
Limiting one’s understanding of the recurring revenue base to only a high level can mask significant issues in the recurring revenue customer base. The story a deep MRR analysis tells may change how the business is analyzed and ultimately valued.
Forvis Mazars has identified several critical deal issues through our detailed MRR analysis:
- For example, significant high-value legacy customers have churned and been replaced by a higher volume of low-margin customers, who are more costly to manage and require greater touchpoints. This created doubt about the “stickiness” of the recurring revenue customers that attracted the investor initially.
- In addition, we have seen companies with limited to no growth in customer headcount present attractive revenue data by focusing on providing service-level upgrades to a few existing customers, calling into question future cash injections needed to build a sales team or customer concentration concerns. Further, a granular analysis of the differences in upsells, add-ons, pricing, and other trends could yield meaningful data points for an investment decision.
- Similarly, apparent increases in MRR could be overstating the business’ ability to generate new recurring revenue if a thorough analysis indicates that customers were acquired in the course of a business combination or that revenue increases resulted from changes in the product mix of sales.
- Finally, we have seen customer churn increasing period over period get obscured by a large influx of new customers at a lower average revenue per customer, casting doubt on the quality of the company’s customer service or the strength of its pricing model. Revenue going up seems positive, but your business could be losing larger, more sophisticated customers. What does that mean for the business? Could it be a client service issue? Why are the bigger customers dissatisfied with your business?
Undoubtedly, a thorough revenue analysis in a clear, easy-to-digest format is appealing to investors so that they can see the true picture of the recurring revenue.
How Forvis Mazars Can Help
If you work with recurring revenue and have been calculating MRR on your own, consider getting insight from the team at Forvis Mazars. We deliver an Unmatched Client Experience® with the forward vision needed to help you truly compare the composition of your revenue stream. If you have questions or want more information on how we can help you reach your potential, reach out to a Forvis Mazars professional today.
